Selected files added: March 7, 2014
 |
New tables will be added as new data become available and tables are developed. |
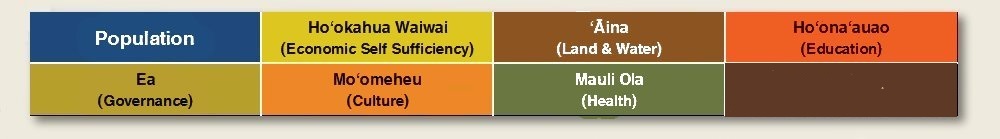
New: Ho‘okahua Waiwai
(Economic Self Sufficiency) |
| Table Taro 01 |
Figure Taro 01a
Figure Taro 01b
Figure Taro 01c
Figure Taro 01d
Figure Taro 01e
|
Taro: Number of Farms, Acreage, Marketing, Price, and Value in State of Hawai‘i: 1992-2012 |
| Table Taro 02 |
— |
Taro: Price, Acreage Harvested, and Production in Hawai‘i: 1946-2013 |
| Table Taro 03 |
— |
Taro: Number of Farms, Acreage, Marketing, Price, and Value in the County of Hawai‘i: 1992-2008 |
| Table Taro 04 |
— |
Taro: Number of Farms, Acreage, Marketing, Price, and Value in the County of Honolulu and Maui: 1992-2008 |
| Table Taro 05 |
— |
Taro: Number of Farms, Acreage, Marketing, Price, and Value in the County of Kaua‘i: 1992-2008 |
| Table Taro 06 |
— |
Taro: Poi Millings by Months in the State of Hawai‘i: 1995-2012 |
New: Ho‘ona‘auao
(Education) |
| |
New tables will be added as new data become available and tables are developed. |
| |
New tables will be added as new data become available and tables are developed. |
| |
New tables will be added as new data become available and tables are developed. |
| |
New tables will be added as new data become available and tables are developed. |